http://www.dailyfx.com/forex/fundamental/daily_briefing/daily_pieces/commodities/2011/01/05/Crude_Oil_Falls_Most_Since_November_Gold_Plunges_after_FOMC_Minutes.html
Commodities – Energy
Crude Oil Falls Most Since November
Crude Oil (WTI) - $89.29 // $0.09 // 0.10%
Commentary: Crude oil fell $2.17, or 2.37%, to settle at $89.38. While the move was not huge, considering the extremely low volatility we’ve been seeing in financial markets recently, it was definitely notable. That being said, it looks like WTI was once again a laggard, as Brent and LLS fell only 1.38% and 1.51% respectively, to $93.53 and $95.88.
U.S. equity markets also sold off initially, but as there was no real negative news flow to sustain the decline, indices recovered much of their losses by the end of the day. Indeed, U.S. Factory Orders actually came out better-than-expected.
While we have been constructive on crude oil for many weeks now and remain bullish on the commodity in general, recently we have suggested that upside may be limited given that prices have risen briskly already. The market may pause as these gains are digested and as we get more clarity on several of the swing variables for 2011, such as OECD demand and non-OPEC supply.
Because of our bullish outlook on crude, we would be using corrections to buy, rather than rallies to sell. But entry points are critical; we would look for something closer to the mid-$80’s in WTI before we begin to accumulate.
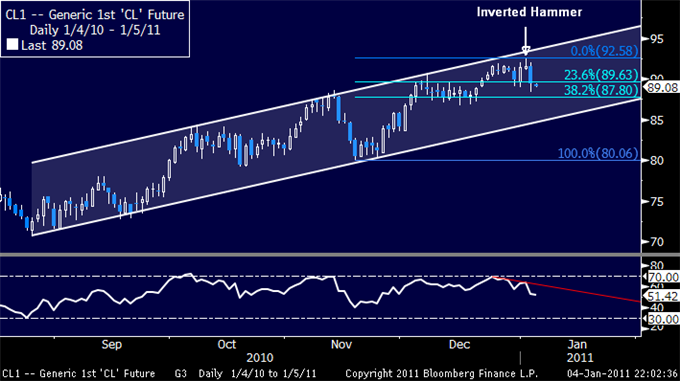
Technical Outlook: Prices dropped through support at $89.63 – the 23.6% Fibonacci retracement of the 11/17/10-1/3/11 upswing – having shown a bearish Inverted Hammer candlestick below resistance at the upper boundary of a rising channel set from August. From here, the bears target the 38.2% level at $87.80.
Commodities – Metals
Gold Plunges after FOMC Minutes
Gold - $1383.00 // $2.28 // 0.16%
Commentary: Gold pulled back notably on Tuesday, shedding $34.08, or 2.41%, to settle at $1380.72. While gold was down for much of the session, we saw losses accelerate after the Minutes to the December FOMC meeting were released. The key takeaway from those was that the Fed is now unlikely to expand its quantitative easing program. In contrast to the statement that immediately followed the meeting, these minutes contained acknowledgement of the constructive economic data we’ve been seeing, as well as the surge in long-term Treasury yields over the past several weeks.
The primary challenge for gold prices in 2011 continues to be the potential for the long-awaited exit from the zero interest rate policy of the Federal Reserve. A tightening of monetary conditions is fundamentally bearish for gold, but it has to influence investor demand for the metal if prices are to respond.
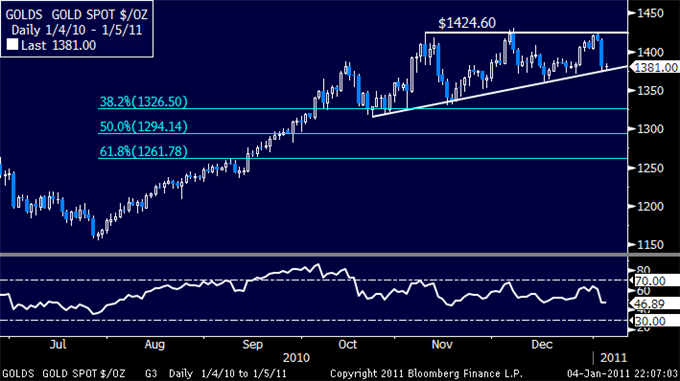
Technical Outlook: As we suggested yesterday, a triple top may be taking shape at $1424.60, with confirmation required on a daily close below rising trend line support set from late October (now at $1375.96). This would open the door for continued selling to $1326.50, the 38.2% Fibonacci retracement of the 7/28/10-12/7/10 advance.
Silver - $29.65 // $0.11 // 0.37%
Commentary: Silver fell $0.94, or 3.06%, to settle at $29.76 on Tuesday. Relatively speaking, the move was quite modest considering that gold fell 2.41%. Over the last month, silver’s volatility has been double that of gold (32% vs 15%), thus 3.06% vs 2.41% indicates that silver performed relatively well on the day. Silver continues to benefit at the expense of gold as investor interest shifts to the cheaper precious metal.
The gold/silver rose to 46.6, but remains near the lowest levels since April 2006. (The gold/silver ratio measures the relative performance of the two precious metals. A higher ratio indicates gold outperformance, while a lower ratio indicates silver outperformance).
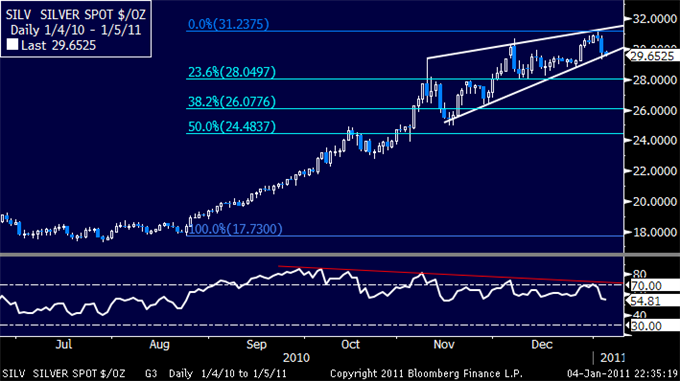
Technical Outlook: Prices have dropped to support at the bottom of a bearish Rising Wedge formation set from early November (now at $26.64).The setup is reinforced by clear-cut negative RSI divergence, with a break lower exposing the 23.6% Fibonacci retracement of the 8/24/10-1/3/11 rally at $28.05.
For real time news and analysis, please visit http://www.dailyfx.com/real_time_news
To receive future articles by email, please contact Ilya at ispivak@dailyfx.com
DailyFX provides forex news on the economic reports and political events that influence the currency market.
Learn currency trading with a free practice account and charts from FXCM.
Learn currency trading with a free practice account and charts from FXCM.
No comments:
Post a Comment