- Dollar: Both the Greenback and S&P 500 Produce a Meek Response to a Strong Round of Data
- Euro Traders Keeping Tabs on the Steady Deterioration of Financial Health into 2011
- British Pound Tumbles Despite Small Business Optimism, Housing Data on Deck
- Japanese Yen Eases its Bullish Run as Risk Trends Fade and the Carry Outlook Returns
- Swiss Franc: Another Record High against the Dollar, Euro and British Pound
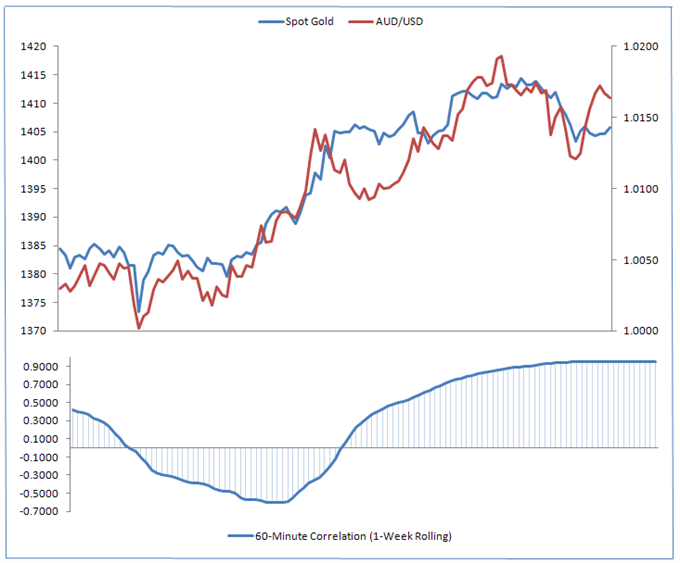
- Australian Dollar Further Deviates from the Bullish Performance of its New Zealand Counterpart
Dollar: Both the Greenback and S&P 500 Produce a Meek Response to a Strong Round of Data
If we needed evidence that trading conditions are highly unusual; we need only look at the performance between the US dollar and S&P 500 through Thursday’s session. The economic listings on the docket were not necessarily the heads of their respective classes; but they produced meaningful enough readings that they tangibly alter the outlook for the performance of the US economy. Yet, this round of event risk would offer little lift to the equities market. In fact, the benchmark indexes ended the day modestly in the red. As for the greenback, the relative improvement of the economic outlook to its major counterparts has proven over time to have limited impact through price action. More remarkable should have been the risk appetite implications on this last-resort safe haven. That said, this data would neither leverage gains through its contributions to the long-term fundamental outlook nor would it spark a swell in risk appetite to encourage a meaningful sell off. The dollar did slide against most of its counterparts but without the conviction necessary to leverage some of the tentative breaks we are seeing (EURUSD, USDCHF, AUDUSD) into meaningful trends.
The disconnect here is participation. There is certainly more than enough liquidity here to sustain trade in the massive global economy; but there is a notable deficiency in the speculative contribution. This is a condition and effect that will only be exacerbated tomorrow. Now counting down to the final trading hours of this year; market participants are keeping to the sidelines until the markets fill out and the potential for trends pick back up in the new year. This will not only curb the development of meaningful trends but it will likely dampen volatility as well. That means that all brands of traders (scalper, momentum, range, breakout, etc) would do best to wait until Monday to jump back into the market. In the meantime, it is worthwhile to take note of the economic data that crossed the wires through Thursday’s session. Because, though it did not produce an event risk trade; it does show a remarkably clear picture of the nation’s overall health. Taking stock of what was offered, we were offered updates on employment, business activity and the housing market. That covers the most contentious areas of the US economy. And, the uniform improvement in these measures suggests that though the region is far from booming, it is showing evidence of the beginnings to a solid recovery. We start with the initial jobless claims figures. The 388,000 filings through December 25th were the fewest since July of 2008. While this indicator may not have the notoriety of next week’s NFP report, it provides a better gauge of employment in general. Before a trend of steady job gains can be established; the pace of firings must abate. Consequently, that is exactly what the data is showing us. Next, the Chicago PMI reading for December is a regional complement to next week’s national ISM manufacturing report. From this indicator though, we see the activity level has accelerated to its fastest clip since 1988, production hit a six year high, while new orders and employment rise to levels not seen in five years. Another component of growth is in place. Finally, we come to the pending home sales report. Though housing has a long way to go before recovering from its deep trough; this report added stability with a better-than-expected 3.5 percent climb. Euro Traders Keeping Tabs on the Steady Deterioration of Financial Health into 2011
The euro performed relatively well against its major counterparts Thursday; but the reasoning to this trend is more likely psychological and speculative in nature than it is fundamental. Position squaring on EURCHF and EURAUD is as sensible as sustaining uncomplicated trends for EURUSD and EURGBP. If we wanted to reach, we could say the move was supported by Markit’s Euro Zone retail sales report for December, which rose to its highest reading since May 2008. That said, this was in large part attributable to Germany. What was really notable though was the sharp jump in yields on a collective 8.1 billion euro debt auction and the Irish Central Bank’s report that its nation’s banks increased borrowing 13.7 percent while private deposits dropped 6.7 percent in November. This data will have its effect going forward.
British Pound Tumbles Despite Small Business Optimism, Housing Data on Deck
Fulfilling the need for a ‘biggest mover,’ the sterling proved the most remarkable mover on the day Thursday. Sharp declines against the dollar and euro were likely flow derived rather than a miraculous reaction to otherwise dull fundamentals and technicals. That said, the BIS (a UK group) reported a net 92 percent of medium-size companies found necessary credit in 2010 and 58 percent expect sales to rise in 2011.
Japanese Yen Eases its Bullish Run as Risk Trends Fade and the Carry Outlook Returns
Correlations have not been exceptionally robust over the past week; but the Japanese yen fell back into line with risk appetite trends Thursday. With the tempered performance of the S&P 500 and other sentiment benchmarks, the funding currency would show relatively little movement. We will have to make a very critical assessment of carry heading into the new year – that will be a conversation for tomorrow.
Swiss Franc: Another Record High against the Dollar, Euro and British Pound
It is difficult to drive any market to a meaningful break; but it is relatively easy to feed momentum after the push has been made. That is the reality we see the franc enjoying. Notching record highs against its euro, dollar and sterling counterparts; this is pure speculative momentum. Fundamentals certainly support it; but it is prudent to moderate our expectations for continuation given already rich levels.
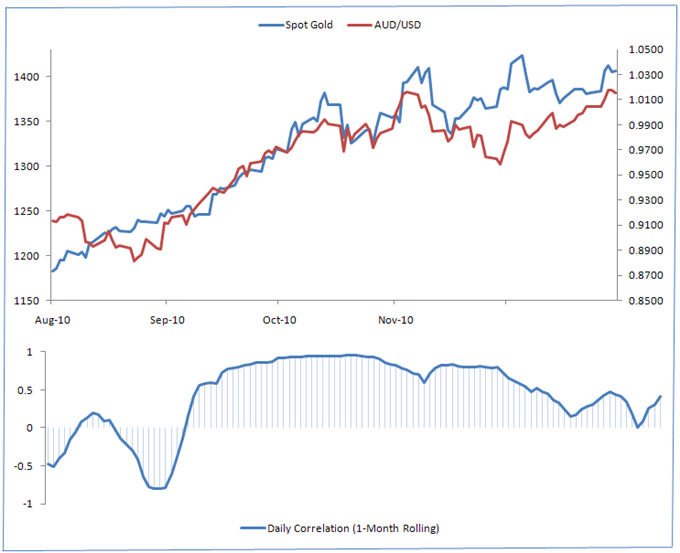
Australian Dollar Further Deviates from the Bullish Performance of its New Zealand Counterpart
Both the Australian and New Zealand dollars reported a decent performance Thursday – after having already run impressive trends in for the past couple weeks. However, once again we see the difference in performance between the two. Another plunge for AUDNZD shows the power of position squaring. Yet, after this necessary correction has run its course, fundamentals could quickly find this pair too cheap.
ECONOMIC DATA
Next 24 Hours
Currency | GMT | Release | Survey | Previous | Comments |
AUD | 0:30 | Private Sector Credit (MoM) (NOV) | 0.2% | 0.1% | Australian bank lending rose MoM in eleven of the past twelve months. |
AUD | 0:30 | Private Sector Credit (YoY) (NOV) | 3.4% | 3.3% |
CNY | 1:35 | MNI Business Condition Survey (DEC) | | 64.14 | Dipped from October’s 65.03 reading. |
GBP | 7:00 | Nationwide House Prices s.a. (MoM) (DEC) | -0.2% | -0.3% | U.K. home prices declined in November for a fourth time in five months. |
GBP | 7:00 | Nationwide House Prices n.s.a. (YoY) (DEC) | -0.3% | 0.4% |
USD | 21:15 | Bloomberg Financial Conditions Index (DEC) | | -0.1 | Negative reading in 6 of last 7 months. |
CNY | 1:00 | Purchasing Manager Index Manufacturing (DEC) | 55 | 55.2 | Nov. reading highest in 10 months. |
| | | | | |
Currency | GMT | Upcoming Events & Speeches | | | |
NZD | | New Zealand Market Closes Early For New Years Eve | | | |
AUD | | Australian Market Closes Early For New Years Eve | | | |
CHF | | Swiss Market Closed For New Years Eve | | | |
SUPPORT AND RESISTANCE LEVELS
CLASSIC SUPPORT AND RESISTANCE - 18:00 GMT
Currency | EUR/USD | GBP/USD | USD/JPY | USD/CHF | USD/CAD | AUD/USD | NZD/USD | EUR/JPY | GBP/JPY |
Resist 2 | 1.3840 | 1.6420 | 89.00 | 1.0000 | 1.0922 | 1.0600 | 0.8230 | 127.60 | 146.05 |
Resist 1 | 1.3700 | 1.5910 | 86.00 | 0.9735 | 1.0750 | 1.0200 | 0.8000 | 120.00 | 140.00 |
Spot | 1.3283 | 1.5417 | 81.53 | 0.9361 | 0.9999 | 1.0159 | 0.7711 | 108.29 | 125.69 |
Support 1 | 1.3000 | 1.5312 | 80.00 | 0.9300 | 0.9950 | 0.9600 | 0.6850 | 103.80 | 125.00 |
Support 2 | 1.2925 | 1.5186 | 75.00 | 0.9000 | 0.9700 | 0.9375 | 0.6585 | 100.00 | 119.00 |
CLASSIC SUPPORT AND RESISTANCE –EMERGING MARKETS 18:00 GMTSCANDIES CURRENCIES 18:00 GMT
Currency | USD/MXN | USD/TRY | USD/ZAR | USD/HKD | USD/SGD | | Currency | USD/SEK | USD/DKK | USD/NOK |
Resist 2 | 14.4500 | 1.6755 | 7.1750 | 7.8165 | 1.4945 | | Resist 2 | 7.7500 | 5.7800 | 6.2750 |
Resist 1 | 13.8500 | 1.5931 | 6.7650 | 7.8075 | 1.4655 | | Resist 1 | 7.5800 | 5.6625 | 6.1150 |
Spot | 12.3834 | 1.5545 | 6.6147 | 7.7820 | 1.2885 | | Spot | 6.7532 | 5.6128 | 5.8885 |
Support 1 | 12.0500 | 1.4724 | 6.4000 | 7.7490 | 1.2750 | | Support 1 | 6.4500 | 5.2625 | 5.7030 |
Support 2 | 11.7200 | 1.3475 | 5.9200 | 7.7450 | 1.2500 | | Support 2 | 6.1250 | 5.1000 | 5.5200 |
INTRA-DAY PIVOT POINTS 18:00 GMT
Currency | EUR/USD | GBP/USD | USD/JPY | USD/CHF | USD/CAD | AUD/USD | NZD/USD | EUR/JPY | GBP/JPY |
Resist 2 | 1.3370 | 1.5609 | 82.13 | 0.9502 | 1.0036 | 1.0238 | 0.7764 | 109.60 | 127.17 |
Resist 1 | 1.3327 | 1.5513 | 81.83 | 0.9432 | 1.0018 | 1.0198 | 0.7738 | 108.94 | 126.43 |
Pivot | 1.3271 | 1.5440 | 81.56 | 0.9391 | 1.0004 | 1.0159 | 0.7700 | 108.28 | 125.97 |
Support 1 | 1.3228 | 1.5344 | 81.26 | 0.9321 | 0.9986 | 1.0119 | 0.7674 | 107.62 | 125.23 |
Support 2 | 1.3172 | 1.5271 | 80.99 | 0.9280 | 0.9972 | 1.0080 | 0.7636 | 106.96 | 124.77 |
INTRA-DAY PROBABILITY BANDS 18:00 GMT
\
Currency | EUR/USD | GBP/USD | USD/JPY | USD/CHF | USD/CAD | AUD/USD | NZD/USD | EUR/JPY | GBP/JPY |
Resist. 3 | 1.3480 | 1.5591 | 82.52 | 0.9482 | 1.0107 | 1.0305 | 0.7824 | 109.95 | 127.51 |
Resist. 2 | 1.3431 | 1.5547 | 82.27 | 0.9452 | 1.0080 | 1.0268 | 0.7796 | 109.54 | 127.06 |
Resist. 1 | 1.3382 | 1.5504 | 82.03 | 0.9422 | 1.0053 | 1.0232 | 0.7768 | 109.12 | 126.60 |
Spot | 1.3283 | 1.5417 | 81.53 | 0.9361 | 0.9999 | 1.0159 | 0.7711 | 108.29 | 125.69 |
Support 1 | 1.3184 | 1.5330 | 81.03 | 0.9300 | 0.9945 | 1.0086 | 0.7654 | 107.46 | 124.78 |
Support 2 | 1.3135 | 1.5287 | 80.79 | 0.9270 | 0.9918 | 1.0050 | 0.7626 | 107.04 | 124.32 |
Support 3 | 1.3086 | 1.5243 | 80.54 | 0.9240 | 0.9891 | 1.0013 | 0.7598 | 106.63 | 123.87 |
v
Written by: John Kicklighter, Currency Strategist for DailyFX.com
To receive John’s reports via email or to submit Questions or Comments about an article; email jkicklighter@dailyfx.com