http://www.dailyfx.com/forex/fundamental/daily_briefing/daily_pieces/scalping_report/2010/12/30/USDCADs_Failed_Test_of_Parity_is_Creating_Ideal_Scalping_Environment.html
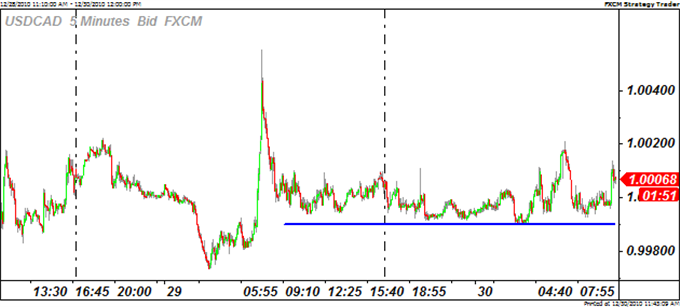
The USD/CAD has seen choppy price action throughout the day as weak Chinese manufacturing and strong U.S. data have helped stem the dollar’s decline. The slower pace of activity for the engine of global growth has sunk commodity prices on the day, which had been generating “loonie” support. Meanwhile, signs of a stronger U.S. recovery are a positive for the Canadian economy which should could limit Canadian dollar weakness and leave the pair confided to its current patterns. The upcoming New Year holiday will see trader interest wane as we head toward the end of the week, making today the last day for scalpers to maximize their profits before spreads widen.
Key Technical Levels
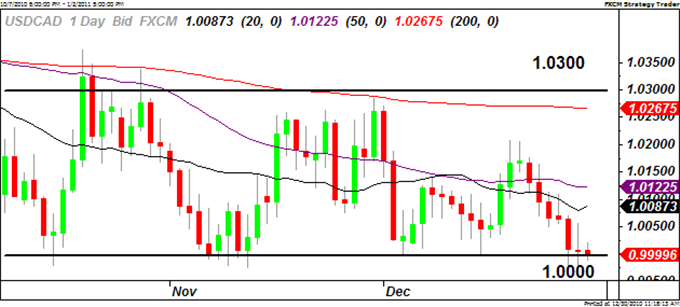
Parity has proven to be staunch support for the pair with it failing to close below the level since despite several recent tests. However, the pair has traded below and intra-day we see that 0.9990 has been formidable and is providing a target level for entering and exiting positions. There are some upside risks to the pair with resistance not coming until the 20-Day SMA at 1.0087.
Key Support/ResistanceLevels to Watch
Pair | S/R | Level | Spot | Valid Since | Market Influence |
USD/CAD | Support | Parity | 1.0000 | 06/04/08 | High |
AUD/USD | Resistance | Yearly High | 1.0182 | 11/05/10 | Medium |
GBP/USD | Support | 200-Day SMA | 1.5396 | 09/14/10 | Medium |
Quantitative Metrics
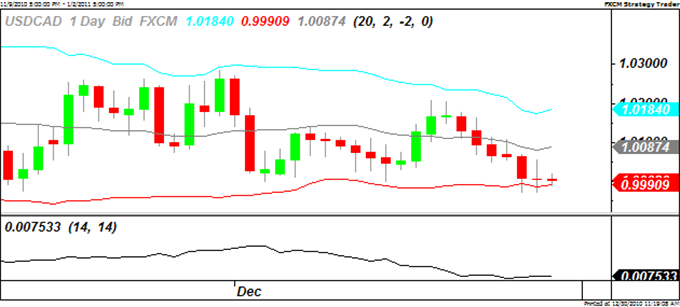
The USD/CAD’s has seen its Bollinger Band’s width shrink to 199 pips as the pair has settled into a narrow range. The pair’s level of variance ranks at the bottom of the majors, enhancing its attractiveness as a scalping target. Daily volatility has also quieted as the pair bounces along parity. The ATR has dipped to 75 pips, again the lowest amongst the most active pairs. Overall implied volatility readings have started to push higher which could be warning of sharp moves at the onset of the New Year.
Volatility / Activity Indicators
EURUSD | GBPUSD | USDJPY | USDCHF | USDCAD | AUDUSD | NZDUSD | GBPJPY | EURJPY | |
ATR(14) | 0.0133 | 0.0138 | 0.7028 | 0.0110 | 0.0075 | 0.0092 | 0.0090 | 1.2278 | 1.0167 |
ATR% | 1.00% | 0.89% | 0.86% | 1.17% | 0.75% | 0.91% | 1.16% | 0.98% | 0.94% |
20-5 Day SMA | 0.0041 | 0.0171 | 0.9961 | 0.0156 | 0.0046 | -0.0148 | -0.0075 | 2.9677 | 1.6583 |
Boll. Band Width | 0.0380 | 0.0666 | 3.0419 | 0.0586 | 0.0199 | 0.0443 | 0.0376 | 8.5586 | 4.8896 |
1 wk Implied Vol | 11.0275 | 8.0100 | 8.9500 | 10.6400 | 7.8850 | 10.8100 | 11.3250 | 8.7200 | 10.1600 |
To discuss this report or be added to the email list, contact John Rivera, Currency Analyst: jrivera@fxcm.com
DailyFX provides forex news on the economic reports and political events that influence the currency market.
Learn currency trading with a free practice account and charts from FXCM.
Learn currency trading with a free practice account and charts from FXCM.
No comments:
Post a Comment